Figuring out precise yields for a farm isn't always easy with terraces and grass strips so we use Microtrak's soiltrak and Arc View to determine the acres they take up.
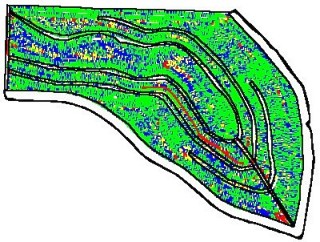
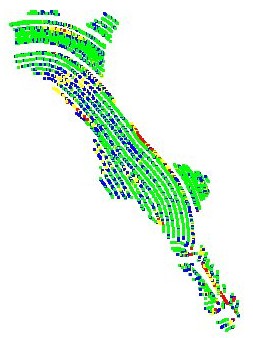
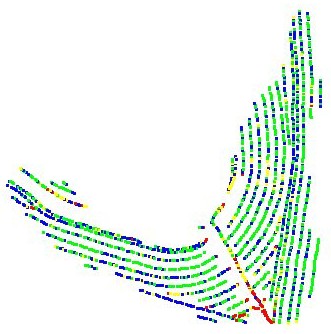
Below is a 1999 soybean yield map of a farm with terraces and grass strips.
Microtrak's grain trak utility reported 42.1 bu/A on 81.23 acres but we always thought this field had more crop acres than that so we were dividing the total bushels by a larger amount of acres.
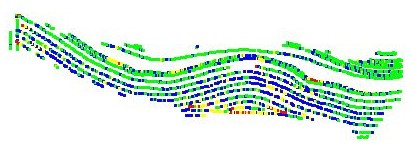
Next are the mapped terraces and grass strips.
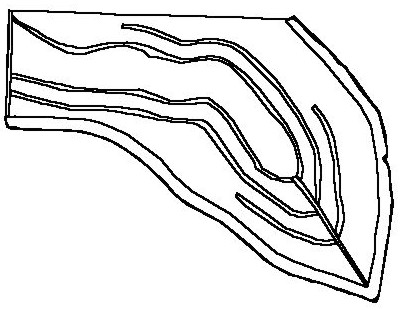
The perimeter of this field equals 109.13 acres.
The terraces and grass strips equals 12.58 acres and the CRP equals 14.33 acres.
After using Soiltrak data and Arc View it shows the crop acres as 82.22 which confirms the accuracy of the Grain Trak Yield map. We always figured the field as over 90 acres so when you work with precision agriculture you need to first determine the exact acres before deciding there is a yield problem elsewhere.
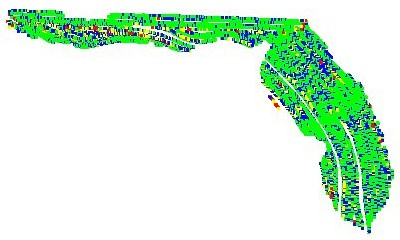
Next we looked at the yield by soil type and soybean suitability
rating using
ISPAID (Iowa Soil Properties And Interpretations Database).
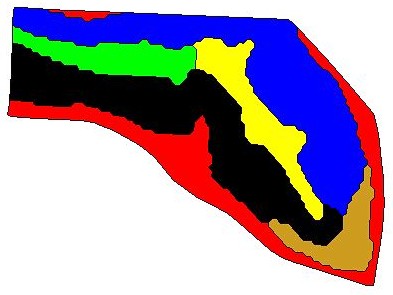
Below are the yield maps by SB yield rating.
The above yield map has a mean yield of 42.57 and has a SB rating of 46 (red section of map above)
The above yield map has a mean yield of 43.7 and has a SB rating of 47 (yellow section of map above)
The above yield map has a mean yield of 42.02 and has a SB rating of 45 (green section of map above)
The above yield map has a mean yield of 43.87 and has a SB rating of 42 (blue section of map above)
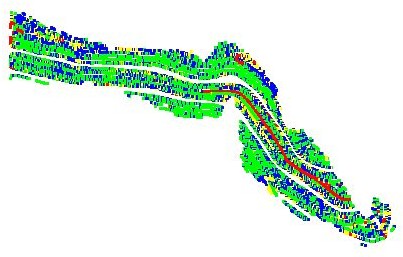
The above yield map has a mean yield of 39.58 and has a SB rating of 36 (black section of map above)
The above yield map has a mean yield of 40.65 and has a SB rating of 36 (brown section of map above)
It appears that the steeper slopes yielded better to their SB rating than the flatter slopes did this year.
Later on this winter I will toy with removing the extreme yield data points from this bean field and then also compare previous years data.