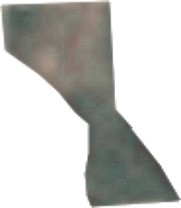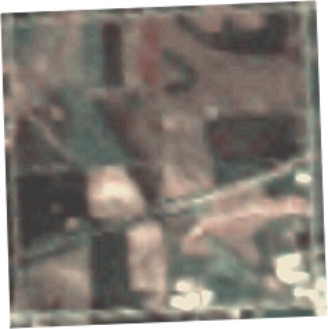
7/15/1999 Satellite Natural color view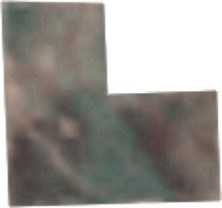 |
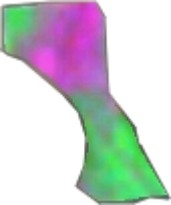
1991 Ortho Aerial view from 6100 meters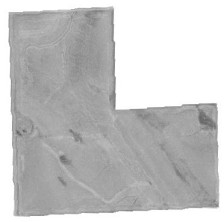 |
| The above view is of the 120 acre farm where the hail fell. | I used ARC View to create this Orthophotographic image of the farm. Carroll county Iowa is one of the counties that the USGS has Ortho imagery on. |
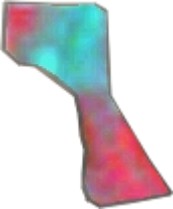
Soil label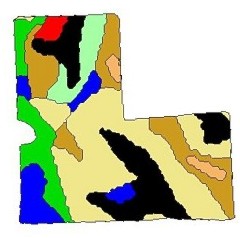 |
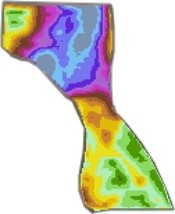
Soil Slope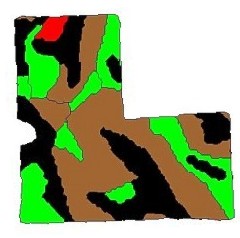 |
| Black= 11B, Lime= 99D2, Red= 9E2, Brown= 9C2
I used ARC View and the Iowa Soils Database CD to create these maps. |
Black= 2-5%, Red= 14-20%, Lime Green= 5-9%, Brown= 9-14% |